Hillsborough County median listing price falls to $408,250
That is 7.1% below last September but still 40.0% above the same month before the pandemic.
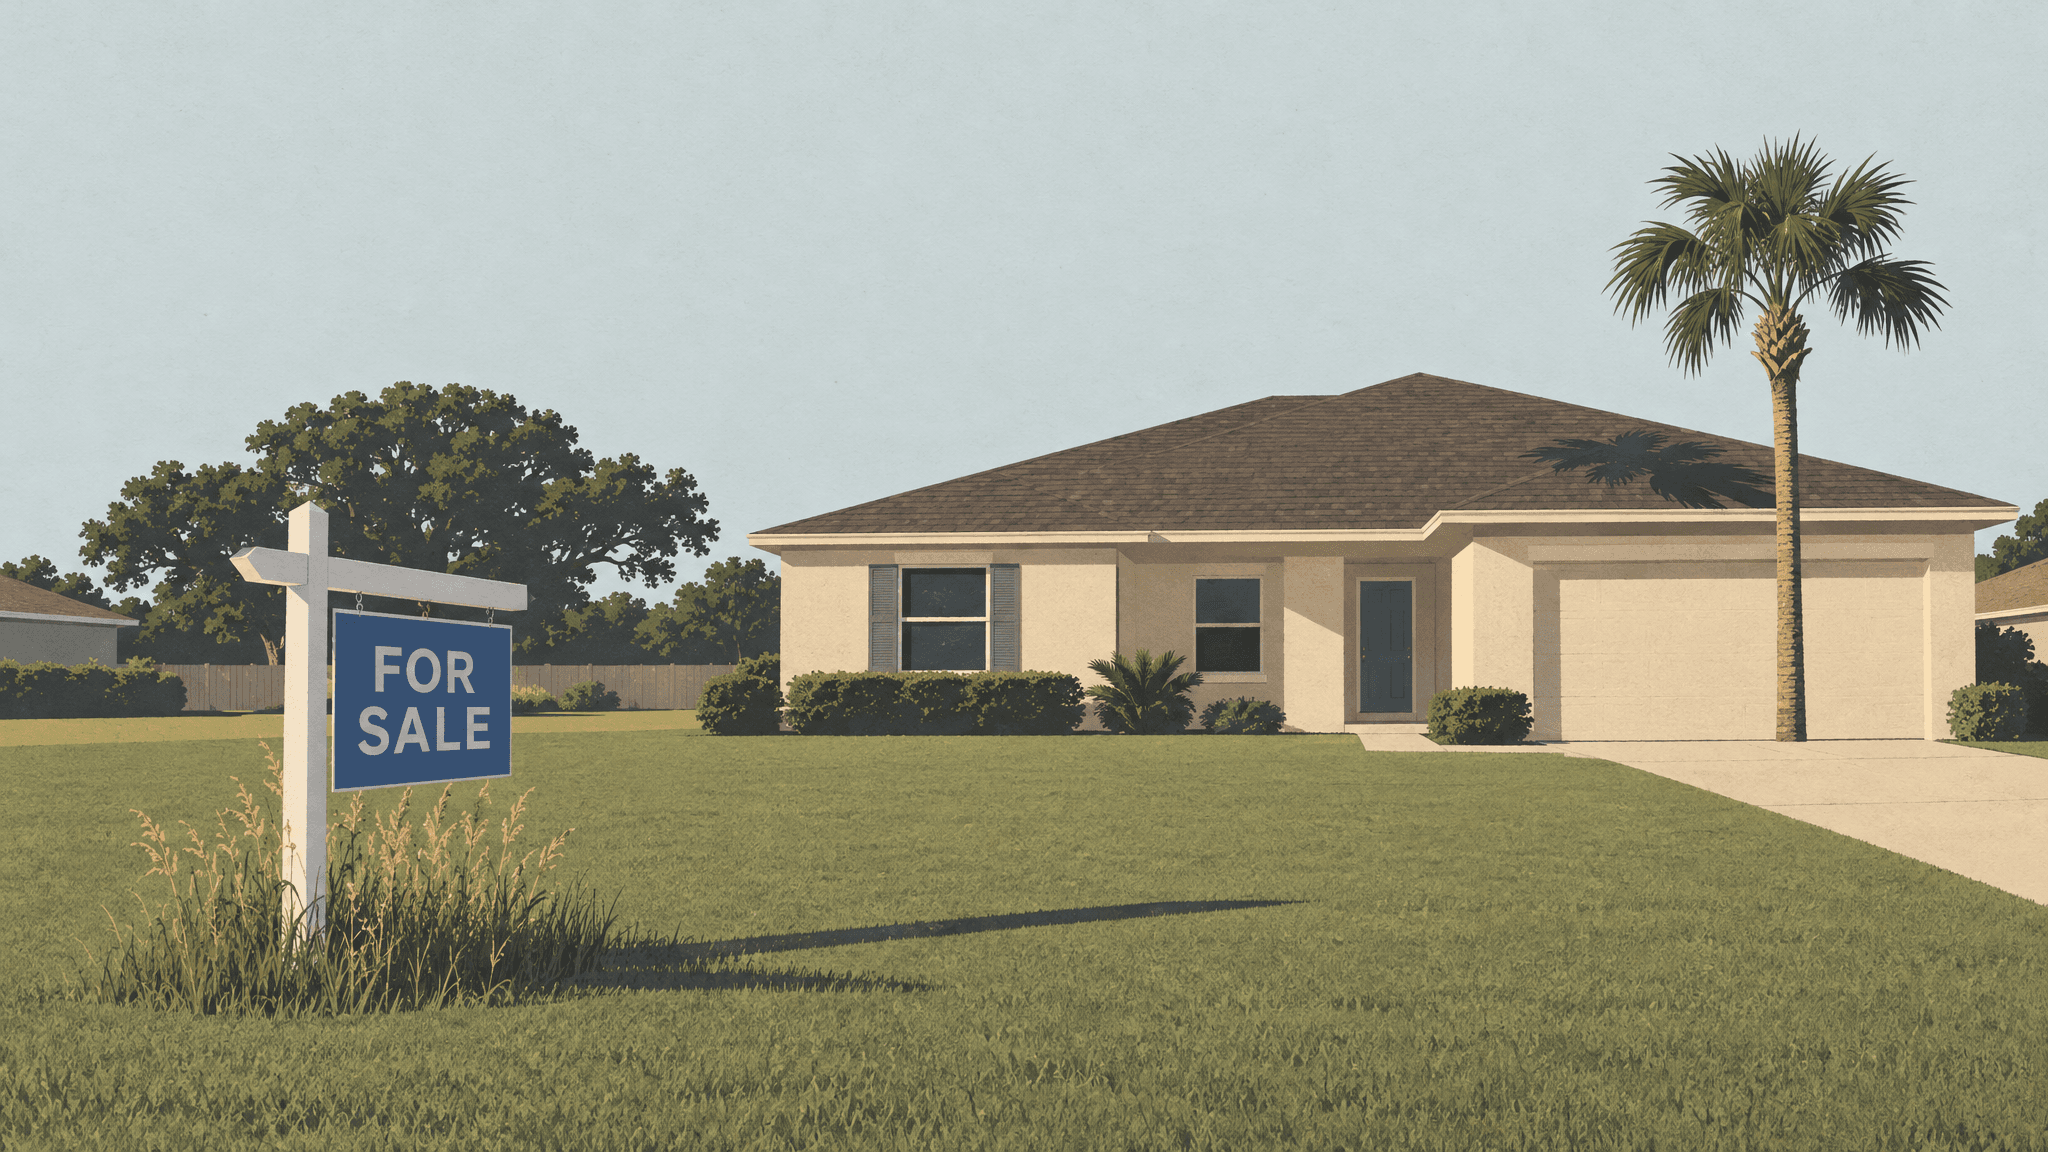
Home buyers in Hillsborough County are seeing lower asking prices this fall than a year ago. The median listing price in September 2026 was $408,250, down 7.1% from $439,575 in September 2025.
At the same time, the county had more homes for sale than in almost any September since 2016. Those homes also sat on the market longer than in most recent years. Together, the figures point to a market that has cooled from its pandemic rush and leans more toward buyers.
But the cooling is not uniform. Compared with last September, listings and selling times both eased slightly. That suggests the shift toward buyers may be leveling off rather than speeding up.
More homes than most Septembers
There were 6,284 active listings in Hillsborough County in September 2026. That ranked 2nd for the most listings among every September from 2016 through 2026.
Inventory fell 2.0% from 6,412 a year earlier. Over the longer run, it remains well above where it stood before the pandemic. Listings were up 14.4% from 5,495 in September 2019, and up 20.3% from September 2016.
For buyers, more listings mean more choice and less pressure to bid fast. For sellers, it means more competition from nearby homes that look a lot like theirs.
The slight dip from last year matches the wider region. Across the Tampa Bay area, active inventory and new listings both fell from a year earlier (tbbwmag.com). That runs against the national trend, where the number of homes for sale rose (tbbwmag.com).
Homes sit longer, and prices give
The typical home listed in Hillsborough County spent 71.0 days on the market in September 2026. That was down from 74.0 days a year earlier, but 15.0 days longer than in September 2019.
This September's median ranked 2nd longest among Septembers since 2016. When homes linger, buyers often have more room to ask for repairs, help with closing costs or a lower price.
Asking prices tell a similar story. The 7.1% drop in the median listing price follows years of steep gains. Even after the decline, this September's median was 40.0% higher than in September 2019 and 49.8% higher than in September 2016.
Among Septembers since 2016, this year's median asking price ranked 5th highest. That puts it below several earlier Septembers, including last year's, but far above prices from before the pandemic.
Sellers across the region are adjusting. A larger share of Tampa Bay area listings got a price cut in September (tbbwmag.com) than listings nationwide (tbbwmag.com).
Realtor.com's figures show a similar drop in the median listing price across the Tampa-St. Petersburg-Clearwater metro (tbbwmag.com). Measured by price per square foot, only Austin posted a steeper decline among the nation's largest metros (tbbwmag.com).
Still, softer prices are not unique to the region. Most of the country's largest metros saw prices per square foot slip from a year earlier (tbbwmag.com).
Why the market slowed
Realtor.com economists linked the broader slowdown in buyer activity to higher mortgage rates, which climbed in the weeks before the report (tbbwmag.com). Higher rates raise monthly payments, and some buyers may wait rather than pay more.
More listings and longer waits do not automatically make homes affordable. Realtor.com Chief Economist Danielle Hale said buyers have more choices and room to negotiate, but affordability still limits how much of that advantage they can use (tbbwmag.com).
That tension shows up in Hillsborough County's numbers. Prices have come down from last year, but the median asking price remains 40.0% above its September 2019 level.
For buyers, the data suggest more leverage than at most points since 2016: plenty of listings, slower sales and sellers willing to cut. For sellers, pricing close to what the market will bear may matter more now than it did during the pandemic rush.
The year-over-year dip in listings and selling time is small. It does not show that the cooling has ended, only that it did not deepen this September compared with last.
The next test comes with the October listing data, which will show whether asking prices keep falling as the fall market winds down. Buyers and sellers should also watch mortgage rates, which Realtor.com economists tied to the recent slowdown in buyer activity (tbbwmag.com).
How we did this
We used monthly listing data for Hillsborough County, posted on Oct. 1, and compared active listings, median days on market and median listing price for September of each year from 2016 through 2026. Comparing only Septembers avoids normal seasonal swings. We ranked September 2026 against the other Septembers and measured changes from September 2025, 2019 and 2016, such as the 7.1% drop in the median listing price from last year.
Active listings: homes listed for sale during the month that had not gone under contract or been taken off the market. Median days on market: the middle value when all listed homes are lined up from the shortest to the longest time on the market. Median listing price: the middle asking price when all listed homes are lined up from the lowest price to the highest. Price cut: a reduction in a home's asking price after it was first listed.
Limitations
- Listing prices are what sellers ask, not what buyers end up paying. Sale prices can differ.
- Active listings are a monthly snapshot of homes for sale and do not show how many homes actually sold.
- County-wide figures can hide big differences between neighborhoods, such as Tampa Heights, VM Ybor or Tampa Palms.
- Regional figures cited from Realtor.com cover the wider Tampa-St. Petersburg-Clearwater metro, not just Hillsborough County.
- Monthly listing figures can be revised after they are first posted.
- The data show what changed, not why. Explanations come from the economists and reports we cite.
Sources
- Federal Reserve Bank of St. Louis (FRED): Housing Inventory: Active Listing Count in Hillsborough County, FL, latest period September 2026, released Oct. 1, 2026; retrieved Oct. 13, 2026. Data
- Federal Reserve Bank of St. Louis (FRED): Housing Inventory: Median Days on Market in Hillsborough County, FL, latest period September 2026, released Oct. 1, 2026; retrieved Oct. 13, 2026. Data
- Federal Reserve Bank of St. Louis (FRED): Housing Inventory: Median Listing Price in Hillsborough County, FL, latest period September 2026, released Oct. 1, 2026; retrieved Oct. 13, 2026. Data
- Federal Reserve Bank of St. Louis (FRED): Housing Inventory: Median Listing Price Year-Over-Year in Hillsborough County, FL, latest period September 2026, released Oct. 1, 2026; retrieved Oct. 13, 2026. Data
More from us
Hillsborough County sellers ask $230 a square foot, down from $242
The 5.0% drop leaves the county's median asking price 8.4% below its high of $251.

Hillsborough County matches Florida's rate of VA health coverage
The VA covers 2.9% of county residents, the same share as statewide and above the U.S. rate of 2.2%.